Building a Blockchain Address Portfolio Tracker tool
Introduction
In this tutorial, we will build a cryptocurrency address portfolio tracker, as a Shinkai Tool. This tool can be a core component of a crypto AI Agent capable of discussing real-time blockchain data.
The tool presented here interacts with the TapTools API to analyze and visualize portfolio data for a specified Cardano wallet address. It retrieves positions for fungible tokens, NFTs, and liquidity provider positions. The tool calculates their values in Ada and a specified quote currency and generates visualizations based on user-defined parameters.
You can find this tool in the Shinkai AI Store. Its name is : Taptools Cardano Portfolio Tracker. You can watch a usage example of this tool here.
While we use a Cardano example, the same tool structure can be applied to any blockchain for which an API provides such data.
Prerequisites
Before you begin, ensure you have :
- the latest version of the Shinkai Desktop App installed,
- the App open at the tool creation UI,
- a Taptools API key.
Step 1 : Choosing a source of data
Common sources of on-chain data are :
- local indexer/node with data fetching capabilities,
- blockchain data provider services,
- decentralized blockchain data protocols,
- crypto wide analytics and market platforms.
Here, we'll use the Taptools API. Taptools is the dominant platform for data about Cardano tokens and NFTs trading as well as wallet tracking. A quick look at the documentation of the API shows that they offer endpoints with practical aggregated data for wallet portfolio analysis.
Step 2 : Prompting Shinkai AI-assisted tool builder
Shinkai allows effortless building of tools and AI Agents thanks to its integrated AI assistance. You can build the tool by just prompting a LLM. You don’t have to wrestle with library dependencies or handle manual deployments, everything is automated and user-friendly.
To create the portfolio tracker tool, navigate to the Shinkai Tools tab, select a programming language, and use the AI 'shinkai_code_gen', because :
- it can access documentation online,
- it thinks about the requirements and asks for feedback before generating the tool.
You can then prompt the AI to build your tool. Use a prompt similar to the one below, with clear instructions :
<task>
create a cardano wallet portfolio tracker tool using the taptools api. Include an option to generate a line graph of the overall wallet value over time, as well as bar graphs per type of positions showing their current values.
</task>

<API documentation>
The documentation for the api to use is at https://openapi.taptools.io/.
</API documentation>

<graphs>
Make graphs in well readable dark mode.
Make graphs optional.
Include in configuration some minimum values per position type, in order to exclude from the text output and from the graphs the dust positions.
</graphs>

<modularity>
Make the tool modular, with options according to the API documentation.
</modularity>

<value calculations>
Fetch the Ada price in the desired quote currency, and use that price to also calculate the value of all positions in quote currency.
Each value in the output should be followed by its unit.
</value calculations>

<explicit naming>
Make sure every single config, input, graph, and output element has a distinct explicit names fully easily understandable.
Do not use abbreviations, use full words, so that it's extra clear.
</explicit naming>

<errors>
Handle potential errors gracefully: if the API returns an error, capture the status code and message, then include them in the output for troubleshooting.
</errors>
![]()
Below is an example of thinking process you might get from Shinkai code generator AI. Review it and follow along.
Code Generation
id: @@localhost.sep-shinkai-jobid_427f8faf-302e-444f-85c8-d3bca6dbe894

Library Analysis
Thinking about: Searching for Required Libraries
AI took 3[s] to process Searching for Required Libraries
Reading https://openapi.taptools.io/
Thinking about: Fetching Documentation
AI took 5[s] to process Fetching Documentation
Reading documentation...

Program Requirements
Thinking about: Analyzing Requirements
Architecting the perfect answer... 5s
Harmonizing with your question... 10s
Calculating the ideal response... 15s
Executing thought protocols... 20s
Diving into the depths of knowledge... 25s
Aligning neural pathways... 30s
Analyzing countless possibilities... 35s
Solving the knowledge puzzle... 40s
AI took 44[s] to process Analyzing Requirements

Requirements
Fetch wallet portfolio positions from TapTools API
Fetch ADA price in specified quote currency from TapTools API
Calculate values of all positions in both ADA and quote currency
Filter out dust positions based on configurable minimum values
Generate line graph of overall wallet value over time (optional)
Generate bar graphs per position type showing current values (optional)
Implement dark mode styling for all graphs
Handle API errors gracefully and include error details in output
Make all configuration options explicit and clearly named
Modular design allowing different API endpoints to be used
Standard Libraries
json : For handling JSON data datetime : For working with timestamps math : For calculations typing : For type hints

Internal Libraries
shinkai_llm_prompt_processor : For generating graph visualizations get_access_token : For API authentication if required

Example Input and Output
Input: { "wallet_address": "stake1u8rphunzxm9lr4m688peqmnthmap35yt38rgvaqgsk5jcrqdr2vuc", "quote_currency": "USD", "generate_line_graph": true, "generate_bar_graphs": true, "dark_mode": true }

Output: { "portfolio_summary": { "total_value_ada": 10000, "total_value_quote": 6100, "currency": "USD", "positions_count": 15, "filtered_positions_count": 3 }, "positions": [ { "type": "FT", "name": "AGIX", "amount": 200, "value_ada": 10000, "value_quote": 6100 } ], "graphs": { "line_graph_path": "/home/user/wallet_value_trend.png", "bar_graph_path": "/home/user/position_values.png" }, "errors": [] }

Config
taptools_api_key: "your-api-key-here" minimum_ada_value_for_display: 10 minimum_quote_value_for_display: 5 dark_mode_primary_color: "#2E3440" dark_mode_secondary_color: "#3B4252" dark_mode_text_color: "#E5E9F0"

Please provide feedback on the requirements or just say OK to confirm
![]()
Also, in this video a working prototype of the Cardano portfolio tracker’s data retrieval feature is built in just a few minutes by simply providing instructions and API documentation snippets.
Step 3 : Improving the tool by prompting the AI
The 'shinkai_code_gen' AI should generate a functional tool based on your instructions. However, you may want to refine it further.
You can for example prompt the AI to :
- rename configs, inputs or outputs keys exactly with precise names,
- improve some number formatting in the output (percentages, rounding in meaningful ways, etc.),
- remove data from the output that comes from the API call but is not of interest,
- modify the layouts of the graphs,
- improve some error messaging,
- etc.
![]()
For reference, here is an example of fully annotated code for a Cardano wallet portfolio tracker tool, obtained after prompting a few times for such improvements.
# /// script
# requires-python = ">=3.10,<3.12"
# dependencies = [
# "requests",
# "matplotlib",
# ]
# ///
# Import necessary modules and types
from typing import Any, Optional, Dict, List # Type hints for better code clarity
from requests import get # HTTP GET requests
import matplotlib.pyplot as plt # Plotting library
from shinkai_local_support import get_home_path # Utility to get user's home directory
# Configuration class for API and value thresholds
class CONFIG:
taptools_api_key: str # API key for TapTools
min_quote_value_ft: str = "1" # Min value for fungible tokens in quote currency
min_quote_value_nft: str = "1" # Min value for NFTs in quote currency
min_quote_value_lp: str = "1" # Min value for liquidity positions in quote currency
# Input class for user-provided parameters
class INPUTS:
address: str # Wallet address to query
quote_currency: str = "USD" # Currency for value quotes (default: USD)
generate_positions_plots: str = "yes" # Option to generate position plots ("yes"/"no")
generate_portfolio_trended_value_graphs: str = "yes" # Option to generate trend graphs ("yes"/"no")
portfolio_trended_value_timeframe: str = "30d" # Timeframe for trend graphs (24h, 7d, 30d, 90d, 180d, 1y, all)
# Output class for storing results
class OUTPUT:
portfolio_positions: Dict[str, Any] # Portfolio data (positions, values)
ada_price_in_quote: float # ADA price in quote currency
error: Optional[str] = None # Error message if request fails
# Main async function to fetch and process portfolio data
async def run(config: CONFIG, inputs: INPUTS) -> OUTPUT:
api_base_url = "https://openapi.taptools.io/api/v1" # Base URL for TapTools API
portfolio_positions_url = f"{api_base_url}/wallet/portfolio/positions?address={inputs.address}" # URL for portfolio positions
token_quote_url = f"{api_base_url}/token/quote?quote={inputs.quote_currency}" # URL for ADA price in quote currency
headers = {
"x-api-key": config.taptools_api_key # API key header for authentication
}
# Fetch ADA price in quote currency
quote_response = get(token_quote_url, headers=headers)
if quote_response.status_code != 200: # Check if request failed
output = OUTPUT()
try:
error_details = quote_response.json() # Parse error details
error_message = error_details.get("message", "An error occurred") # Extract error message
except json.JSONDecodeError: # Handle non-JSON response
error_message = quote_response.text
output.error = f"Error fetching ADA price: {error_message} (Status Code: {quote_response.status_code})" # Set error
return output
ada_price_in_quote = quote_response.json().get("price", 0) # Extract ADA price
ada_price_attr_name = f"ada_price_in_{inputs.quote_currency}" # Dynamic attribute name for ADA price
# Fetch portfolio positions
response = get(portfolio_positions_url, headers=headers)
output = OUTPUT() # Initialize output object
if response.status_code == 200: # Check if request succeeded
data = response.json() # Parse response JSON
# Rename keys for clarity
data["Number_of_Fungible_Tokens"] = data.pop("numFTs", 0) # Number of fungible tokens
data["Number_of_NFT_collections"] = data.pop("numNFTs", 0) # Number of NFT collections
data["Fungible_Tokens_positions"] = data.pop("positionsFt", []) # Fungible token positions
data["NFTs_positions"] = data.pop("positionsNft", []) # NFT positions
data["Liquidity_Provider_Positions"] = data.pop("positionsLp", []) # Liquidity provider positions
# Process fungible token positions
for position in data["Fungible_Tokens_positions"]:
for timeframe in ["24h", "7d", "30d"]: # Process price changes for timeframes
if timeframe in position:
change_value = position[timeframe] # Get change value
sign = "+" if change_value >= 0 else "" # Add sign for positive/negative
position[timeframe] = f"{sign}{round(change_value * 100, 2)} %" # Format as percentage
# Round and rename values
position["Value_in_Ada"] = round(position.pop("adaValue", 0), 2) # Value in ADA
position["Liquid_Value_in_Ada"] = round(position.pop("liquidValue", 0), 2) # Liquid value in ADA
position["Value_in_" + inputs.quote_currency] = round(position["Value_in_Ada"] * ada_price_in_quote, 2) # Value in quote currency
position["Liquid_Value_in_" + inputs.quote_currency] = round(position["Liquid_Value_in_Ada"] * ada_price_in_quote, 2) # Liquid value in quote currency
position["Liquid_Balance_in_Ada"] = position.pop("liquidBalance", 0) # Liquid balance in ADA
position.pop("unit", None) # Remove unused unit field
position.pop("fingerprint", None) # Remove unused fingerprint field
# Process NFT positions
for position in data["NFTs_positions"]:
for timeframe in ["24h", "7d", "30d"]: # Process price changes for timeframes
if timeframe in position:
change_value = position[timeframe] # Get change value
sign = "+" if change_value >= 0 else "" # Add sign for positive/negative
position[timeframe] = f"{sign}{round(change_value * 100, 2)} %" # Format as percentage
# Round and rename NFT values
position["Value_in_Ada"] = round(position.pop("adaValue", 0), 2) # Value in ADA
position["Value_in_" + inputs.quote_currency] = round(position["Value_in_Ada"] * ada_price_in_quote, 2) # Value in quote currency
position["Floor_Price_in_Ada"] = position.pop("floorPrice", 0) # Floor price in ADA
position["Floor_Price_in_" + inputs.quote_currency] = round(position["Floor_Price_in_Ada"] * ada_price_in_quote, 2) # Floor price in quote currency
# Process liquidity provider positions
for position in data["Liquidity_Provider_Positions"]:
position["Value_in_Ada"] = round(position.pop("adaValue", 0), 2) # Value in ADA
position["Value_in_" + inputs.quote_currency] = round(position["Value_in_Ada"] * ada_price_in_quote, 2) # Value in quote currency
# Calculate total portfolio value
total_value_in_ada = data.pop("adaValue", 0) # Total portfolio value in ADA
data["Total_Portfolio_Value_in_Ada"] = round(total_value_in_ada, 2) # Rounded total in ADA
data["Total_Portfolio_Value_in_" + inputs.quote_currency] = round(total_value_in_ada * ada_price_in_quote, 2) # Total in quote currency
setattr(output, ada_price_attr_name, ada_price_in_quote) # Set ADA price in output
output.portfolio_positions = data # Store portfolio data in output
# Generate position plots if requested
if inputs.generate_positions_plots.lower() == "yes":
home_path = await get_home_path() # Get home directory for saving plots
plt.style.use('dark_background') # Set dark theme for plots
# Convert min values to float for comparison
min_value_ft = float(config.min_quote_value_ft) # Min value for fungible tokens
min_value_nft = float(config.min_quote_value_nft) # Min value for NFTs
min_value_lp = float(config.min_quote_value_lp) # Min value for liquidity positions
# Plot fungible tokens
ft_names = [p.get("ticker", "") for p in data["Fungible_Tokens_positions"] if p.get("Value_in_" + inputs.quote_currency, 0) >= min_value_ft] # Token names
ft_values = [p.get("Value_in_" + inputs.quote_currency, 0) for p in data["Fungible_Tokens_positions"] if p.get("Value_in_" + inputs.quote_currency, 0) >= min_value_ft] # Token values
sorted_ft = sorted(zip(ft_values, ft_names), reverse=True) # Sort by value descending
plt.figure(figsize=(10, 6)) # Set plot size
plt.bar([name for _, name in sorted_ft], [value for value, _ in sorted_ft]) # Create bar plot
plt.title("Fungible Tokens Value") # Set title
plt.xlabel("Token") # Set x-axis label
plt.ylabel(f"Value in {inputs.quote_currency}") # Set y-axis label
plt.xticks(rotation=45, ha="right") # Rotate x-axis labels
plt.tight_layout() # Adjust layout
plt.savefig(f"{home_path}/fungible_tokens_value.png") # Save plot
plt.close() # Close plot
# Plot NFTs
nft_names = [p.get("name", "") for p in data["NFTs_positions"] if p.get("Value_in_" + inputs.quote_currency, 0) >= min_value_nft] # NFT names
nft_values = [p.get("Value_in_" + inputs.quote_currency, 0) for p in data["NFTs_positions"] if p.get("Value_in_" + inputs.quote_currency, 0) >= min_value_nft] # NFT values
sorted_nft = sorted(zip(nft_values, nft_names), reverse=True) # Sort by value descending
plt.figure(figsize=(10, 6)) # Set plot size
plt.bar([name for _, name in sorted_nft], [value for value, _ in sorted_nft]) # Create bar plot
plt.title("NFTs Value") # Set title
plt.xlabel("NFT") # Set x-axis label
plt.ylabel(f"Value in {inputs.quote_currency}") # Set y-axis label
plt.xticks(rotation=45, ha="right") # Rotate x-axis labels
plt.tight_layout() # Adjust layout
plt.savefig(f"{home_path}/nfts_value.png") # Save plot
plt.close() # Close plot
# Plot liquidity provider positions
lp_names = [p.get("ticker", "") for p in data["Liquidity_Provider_Positions"] if p.get("Value_in_" + inputs.quote_currency, 0) >= min_value_lp] # Position names
lp_values = [p.get("Value_in_" + inputs.quote_currency, 0) for p in data["Liquidity_Provider_Positions"] if p.get("Value_in_" + inputs.quote_currency, 0) >= min_value_lp] # Position values
sorted_lp = sorted(zip(lp_values, lp_names), reverse=True) # Sort by value descending
plt.figure(figsize=(10, 6)) # Set plot size
plt.bar([name for _, name in sorted_lp], [value for value, _ in sorted_lp]) # Create bar plot
plt.title("Liquidity Provider Positions Value") # Set title
plt.xlabel("Position") # Set x-axis label
plt.ylabel(f"Value in {inputs.quote_currency}") # Set y-axis label
plt.xticks(rotation=45, ha="right") # Rotate x-axis labels
plt.tight_layout() # Adjust layout
plt.savefig(f"{home_path}/liquidity_provider_positions_value.png") # Save plot
plt.close() # Close plot
# Generate trend graphs if requested
if inputs.generate_portfolio_trended_value_graphs.lower() == "yes":
trend_base_url = f"{api_base_url}/wallet/value/trended" # URL for portfolio trend data
# Fetch trend data in ADA
trend_response_ada = get(f"{trend_base_url}?address={inputs.address}&timeframe={inputs.portfolio_trended_value_timeframe}"e=ADA", headers=headers)
if trend_response_ada.status_code == 200: # Check if request succeeded
trend_data_ada = trend_response_ada.json() # Parse response JSON
times_ada = [entry["time"] for entry in trend_data_ada] # Extract time points
values_ada = [entry["value"] for entry in trend_data_ada] # Extract values
plt.figure(figsize=(10, 6)) # Set plot size
plt.plot(times_ada, values_ada, marker='o') # Create line plot
title_ada = "Portfolio Value Trend in ADA (all time)" if inputs.portfolio_trended_value_timeframe == "all" else f"Portfolio Value Trend in ADA over {inputs.portfolio_trended_value_timeframe}" # Set dynamic title
plt.title(title_ada) # Set title
plt.ylabel("Value in ADA") # Set y-axis label
plt.xticks([]) # Remove x-axis labels
plt.tight_layout() # Adjust layout
plt.savefig(f"{home_path}/portfolio_trend_ada.png") # Save plot
plt.close() # Close plot
# Fetch trend data in quote currency
trend_response_quote = get(f"{trend_base_url}?address={inputs.address}&timeframe={inputs.portfolio_trended_value_timeframe}"e={inputs.quote_currency}", headers=headers)
if trend_response_quote.status_code == 200: # Check if request succeeded
trend_data_quote = trend_response_quote.json() # Parse response JSON
times_quote = [entry["time"] for entry in trend_data_quote] # Extract time points
values_quote = [entry["value"] for entry in trend_data_quote] # Extract values
plt.figure(figsize=(10, 6)) # Set plot size
plt.plot(times_quote, values_quote, marker='o') # Create line plot
title_quote = f"Portfolio Value Trend in {inputs.quote_currency} (all time)" if inputs.portfolio_trended_value_timeframe == "all" else f"Portfolio Value Trend in {inputs.quote_currency} over {inputs.portfolio_trended_value_timeframe}" # Set dynamic title
plt.title(title_quote) # Set title
plt.ylabel(f"Value in {inputs.quote_currency}") # Set y-axis label
plt.xticks([]) # Remove x-axis labels
plt.tight_layout() # Adjust layout
plt.savefig(f"{home_path}/portfolio_trend_{inputs.quote_currency.lower()}.png") # Save plot
plt.close() # Close plot
else: # Handle failed portfolio request
try:
error_details = response.json() # Parse error details
error_message = error_details.get("message", "An error occurred") # Extract error message
except json.JSONDecodeError: # Handle non-JSON response
error_message = response.text
output.error = f"Error: {error_message} (Status Code: {response.status_code})" # Set error
return output # Return output object
Feel free to extend this tool further by adding additional features or integrating with other APIs !
Step 4 : Improving the tool metadata
Shinkai automates tool metadata generation, but you can enhance it.
Good tool metadata should include :
- an explicit tool title,
- a thorough description (features, options, requirements, extra information),
- explicit descriptions for configurations and inputs,
- adequate usable keywords to trigger the tool.
Go to the metadata section, and improve the above. Below is a good metadata for the tool.
{
  "homePage": "",
  "configurations": {
    "type": "object",
    "properties": {
      "min_quote_value_ft": {
        "description": "Minimum value in quote currency for fungible tokens to be included in the graph. This is used to filter out dust tokens from the graph. Default is 1 (1 USD or 1 EUR).",
        "type": "string"
      },
      "min_quote_value_lp": {
        "description": "Minimum value in quote currency for liquidity positions to be included in the graph. This is used to filter out eventual residual positions. Default is 1 (1 USD or 1 EUR).",
        "type": "string"
      },
      "min_quote_value_nft": {
        "description": "Minimum value in quote currency value for NFT collections to be include in the graph. Default is 1 (1 USD or 1 EUR).",
        "type": "string"
      },
      "taptools_api_key": {
        "description": "The API key for TapTools",
        "type": "string"
      }
    },
    "required": [
      "taptools_api_key"
    ]
  },
  "parameters": {
    "type": "object",
    "properties": {
      "address": {
        "description": "Cardano wallet address to scan.",
        "type": "string"
      },
      "generate_portfolio_trended_value_graphs": {
        "description": "Whether to generate portfolio trended value graphs. yes or no. Default is yes.",
        "type": "string"
      },
      "generate_positions_plots": {
        "description": "Whether to generate plots for portfolio positions. yes or no. Default is yes.",
        "type": "string"
      },
      "portfolio_trended_value_timeframe": {
        "description": "The timeframe to use for portfolio trended value graphs. Options are 24h, 7d, 30d, 90d, 180d, 1y, all. Default is 30d.",
        "type": "string"
      },
      "quote_currency": {
        "description": "The quote currency to use. USD or EUR. Default is USD.",
        "type": "string"
      }
    },
    "required": [
      "address"
    ]
  },
  "result": {
    "type": "object",
    "properties": {
      "ada_price_in_quote": {
        "description": "The price of ADA in the quote currency",
        "type": "number"
      },
      "error": {
        "description": "Error message if any",
        "nullable": true,
        "type": "string"
      },
      "portfolio_positions": {
        "description": "The portfolio positions data",
        "type": "object"
      }
    },
    "required": [
      "portfolio_positions",
      "ada_price_in_quote"
    ]
  },
  "sqlTables": [],
  "sqlQueries": [],
  "oauth": [],
  "runner": "any",
  "operating_system": [
    "linux",
    "macos",
    "windows"
  ],
  "tool_set": "",
  "keywords": [
    "portfolio",
    "taptools",
    "cardano",
    "address",
    "tracker"
  ],
  "version": "1.0.0"
}
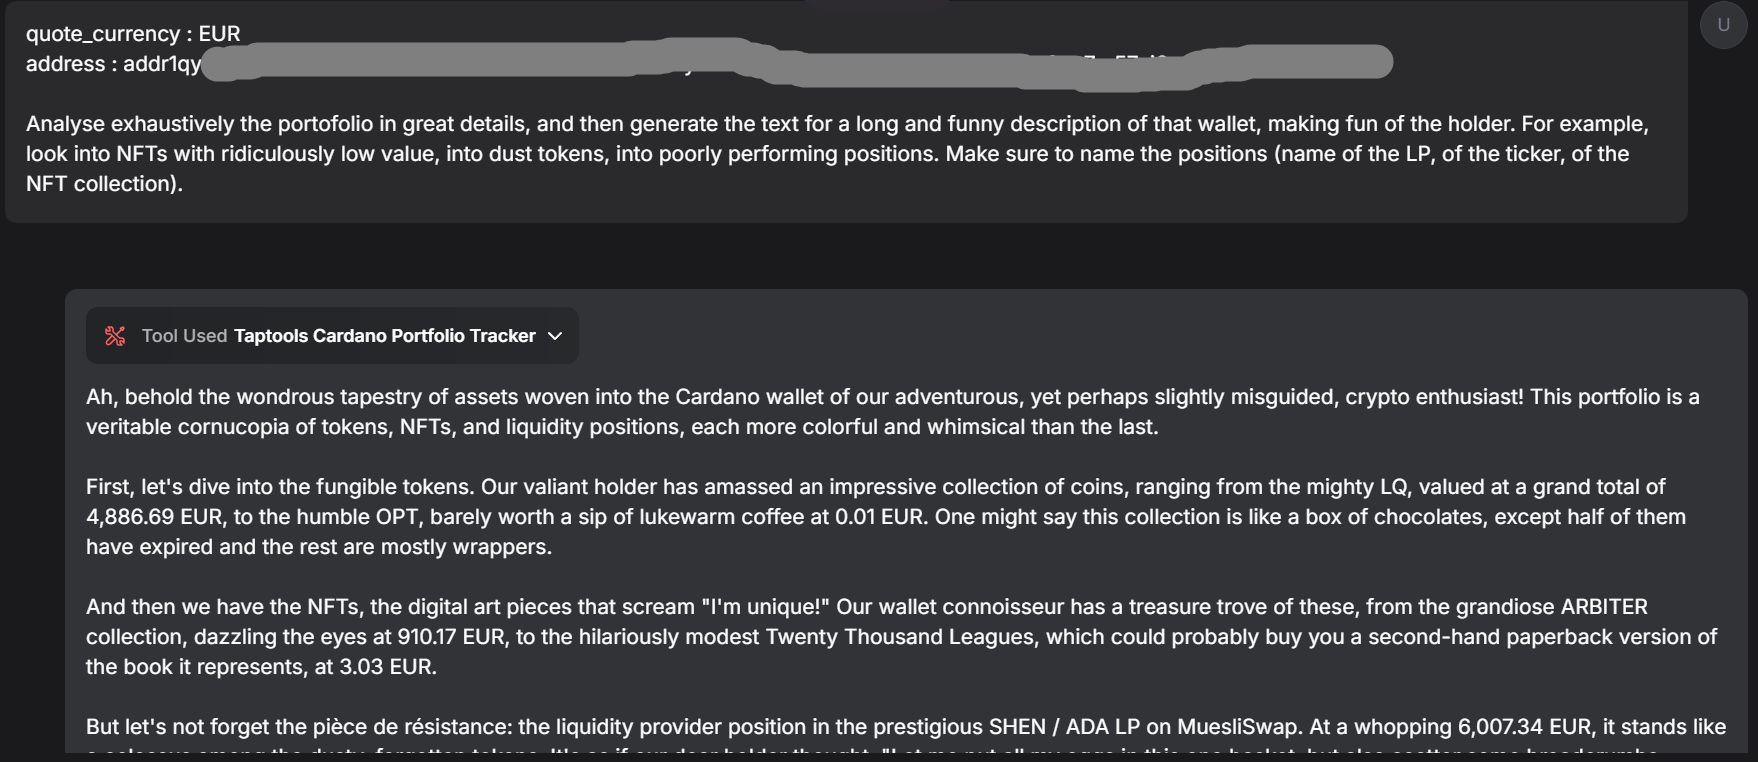
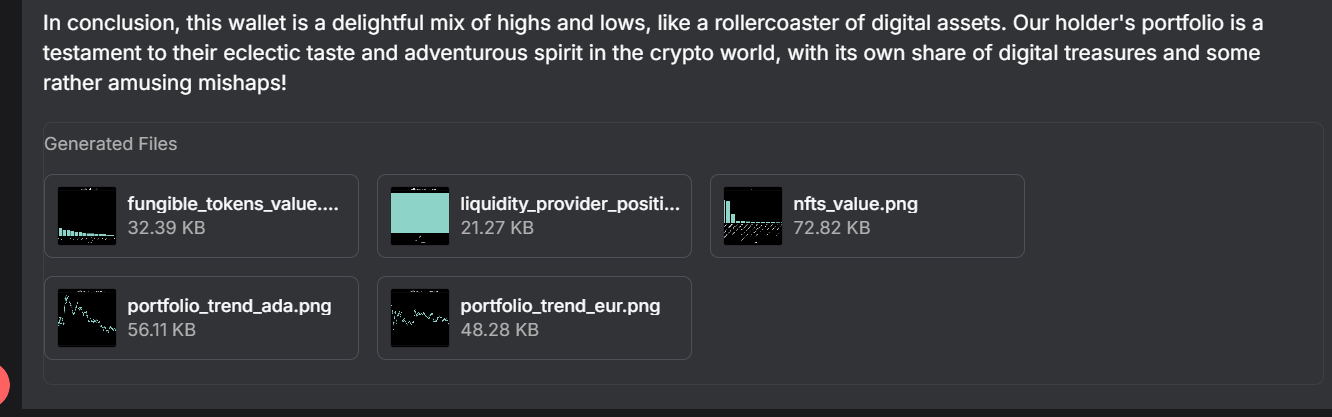
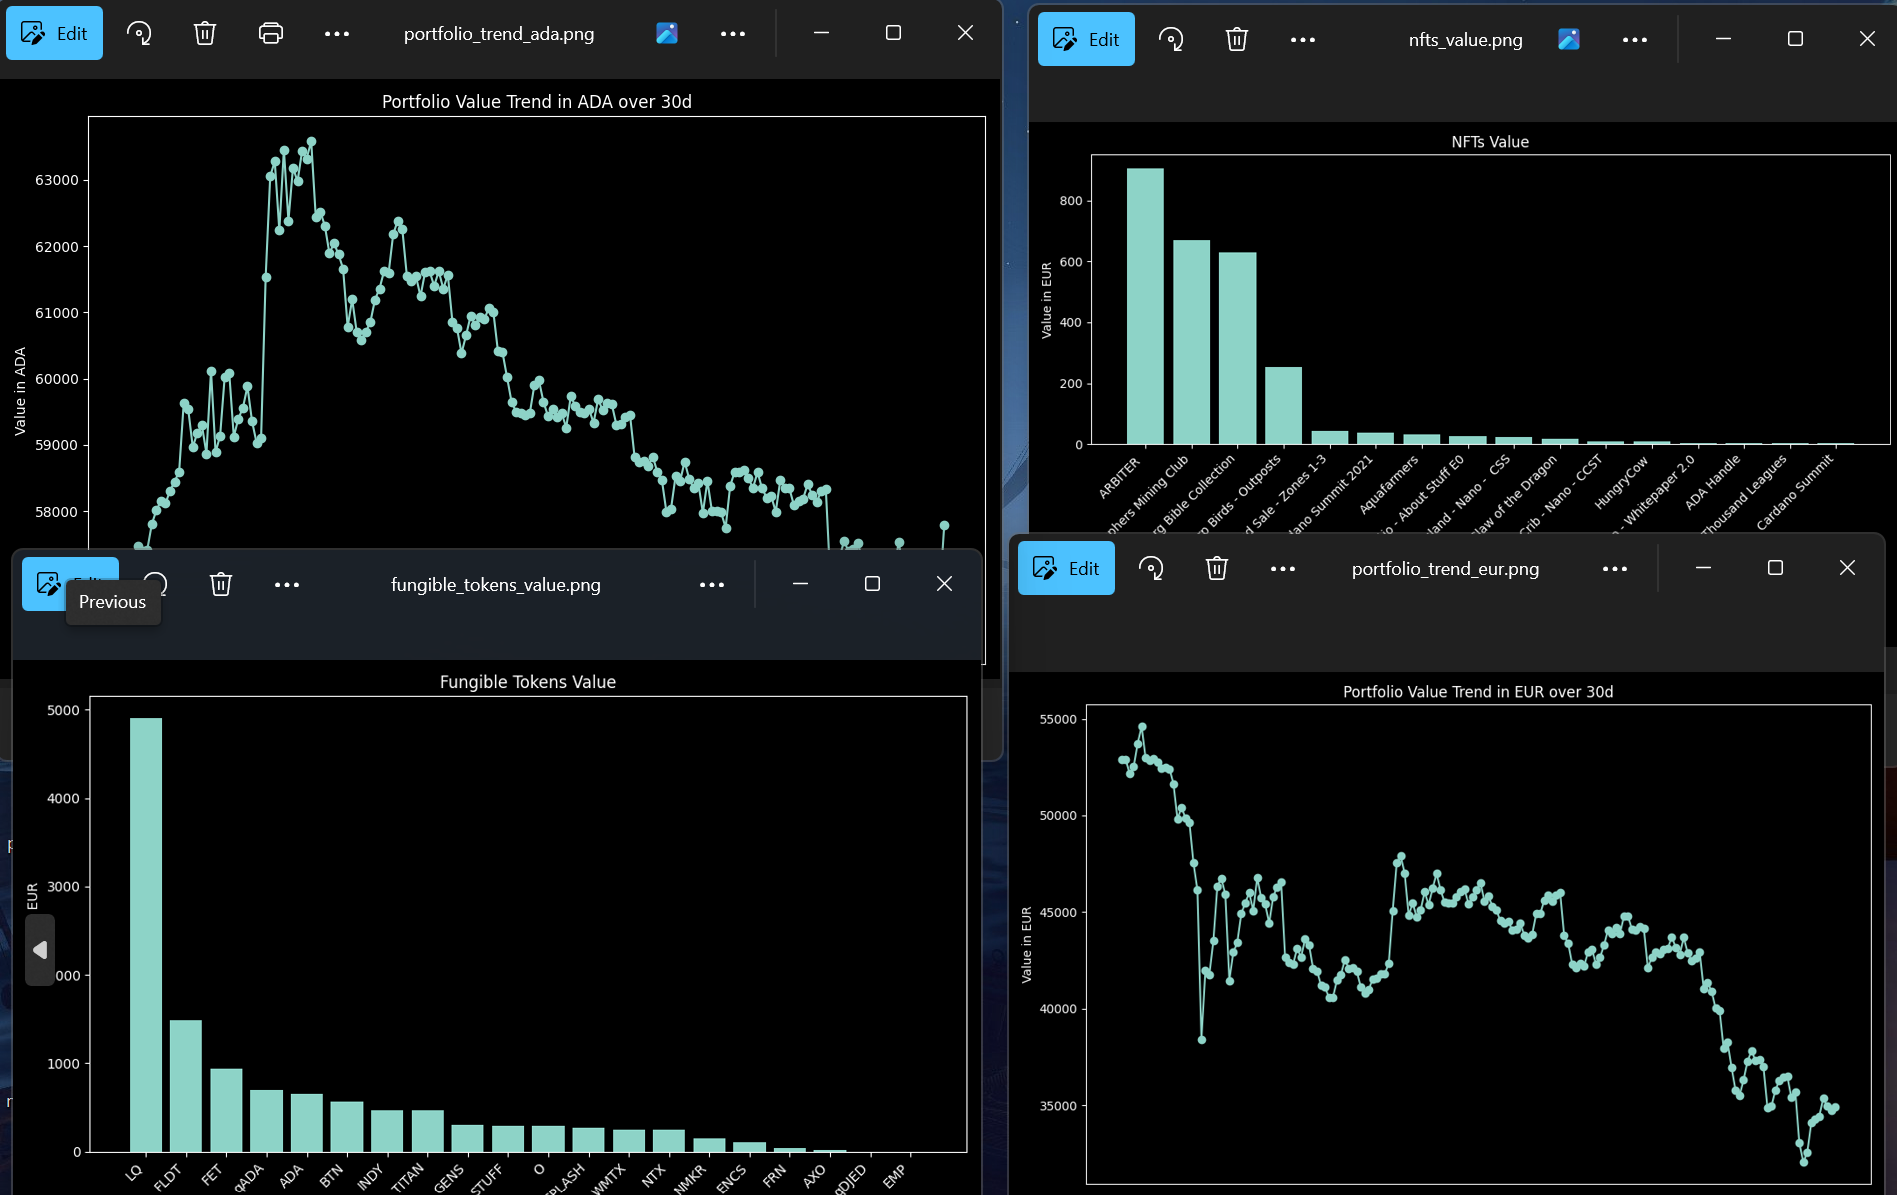
Screenshots
Below are 4 screenshots of our portfolio tracker tool being used in Shinkai.